
Deep Dive: Grow Your Firm With Insightful Reporting & Analytics

While Lawmatics has all the tools you need for collecting and inputting data, what good is all that data if you aren’t using it to gain insights on the performance of your firm? With the power of Lawmatics Custom Reporting and the Analytics Dashboard, you are able to make decisions from a business standpoint to grow and improve your firm.
In addition to the KPIs you should be monitoring, Lawmatics gives you the ability to customize and export any of your reports. Meanwhile, the analytics dashboard grants you easy access to metrics like conversion rate, cost per lead, and custom growth goal settings.
With all of these features at your fingertips, you’ll be able to grow your business without any guesswork or lack of insights into the trajectory of your business.
Custom Reporting
With custom reporting the possibilities are truly endless in Lawmatics. Slice and dice your data any way you want by essentially creating a table with any fields, filters, grouping, and date range. Furthermore, your reports automatically refresh in real time, meaning that each time you view one, you are seeing the most up-to-date information.
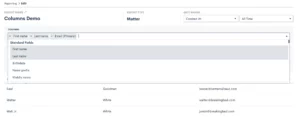
Columns
The first step in creating your custom report is to add fields to be used for your columns. Select from any of the built-in system fields, or any of your custom fields. Simply scroll though the complete list of fields, as shown below, or start typing the name of a field to easily access it.
Any fields that you select will be added as a column into your report.
Filters
Depending on the goal of your particular report, filters can be your best friend. These let you keep the report relevant to the specific KPI, field, etc that you wish to report on.
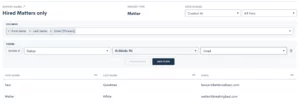
For example, you may create a custom report to only show hired clients. This can be useful if you are looking to narrow in on a data point relevant only to current or past clients, as opposed to leads or lost leads. To do this, simply add a filter. In the example below, we have filtered the report using the Source field, and have selected to only show the Hired matters.
Once you make this selection, the report preview will update to show only results specified by your filters.
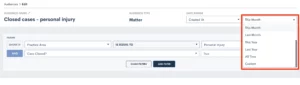
Date Range
Similar to adding field filters, you may also filter your report by date. Create a report that shows only the current week or month at a glance, and each time you view it it will be up-to-date for the current date match.
Use the drop down in the top left to first select which date field you want to filter on. For instance, the date the matter was created, converted, or any other custom date field.
Then select the date range, using one of the preset options, or create a static custom range for this report.
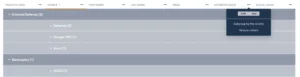
Grouping
You may have plenty of reports where simply adding columns and filters gets you the data you need. Grouping is a power feature that can add even more insights to your report. When you group by a particular column you will be able to easily see the total number of results in each group, which can help determine performance.
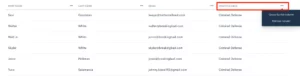
For example, you may wish to see how many leads came in for each of your practice areas in a particular month. Grouping would be very useful in this situation. Click the column header, and then select Group by this column.
The report will then look as follows:
We can easily see that Criminal Defense was the most used practice area in the graph above. Also notice how you have the option to subgroup, as shown in the top right corner in the image above. This will add a second grouping by that field within each main group.
Sample Reports
Let’s walk through a few sample reports that may be useful for your firm. Keep in mind that the sky’s the limit when it comes to custom reporting, so these are merely suggestions to get you started.
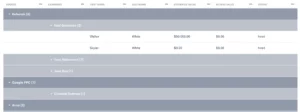
First, you may find it useful to create a report showing the marketing source of each matter in your CRM. When you select your columns for this report, make sure to include both the “source” and “campaign” fields, in addition to whatever fields you may wish to see like practice area, converted date, phone number, etc.
You will find grouping on the “source” field helpful for this report, so that you can easily see how many matters came from each source. Then, we suggest adding a sub group by “campaign”, so you can also see insights on each campaign within your sources. Your report will end up looking something like this:
Example KPIs pictured above:
- Matters per marketing source
- Campaign breakdown within each source
Another way you can use a custom report is to track the estimated and actual values of your cases. When you add either, or both, of these fields to your report you will have the option to sum or average each of these columns. Of course with this report it is important to make sure that you are populating these values on each of your matters accurately and timely in order to get best results.
When you use any currency or number type field on a report you will have the option to add a sum or average calculation, as shown below.
In this example, we have opted to sum the estimated value, but average the actual value.
Example KPIs pictured above:
- Matters per practice area
- Total value in pipeline per practice area and per source
- Average revenue per practice area and per source
Remember that any of these custom reports can also be exported to excel, where you can apply more advanced calculations and formulas as needed.
Analytics Page
In addition to building your own custom reports, Lawmatics also provides you with a built-in analytics dashboard for basic firm KPIs and other statistics. You’ll find this page by hovering your mouse on the Insights tab, and then select Analytics.
Dashboard
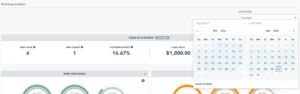
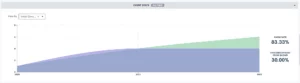
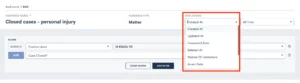
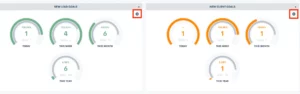
When you first arrive on the Analytics page you will first see the Leads at a Glance section of the dashboard. Before diving into these stats, first note that you can adjust the date range of this page as a whole. You’ll find this in the top right corner, it defaults to All Time, but you can make a custom date selection accordingly.
Once you have selected your desired date range, all data on the page will update automatically. First, in the Leads at a Glance section you’ll see a quick breakdown of some key statistics for lead intake and conversion.
As you scroll down the Analytics page, you will see a number of different graphs and charts for nearly every aspect of your firm. We’ll walk through a few of them here.
First, set customized growth goals for new leads and converted clients by clicking the icon highlighted below.
While you can also use custom reporting for reporting on things like leads per practice area or source, the Analytics page gives you a visual breakdown of the same information. This can be great for getting a snapshot view.
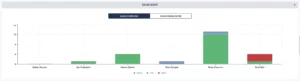
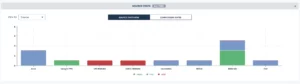
Additionally, you’ll find a built-in graph for tracking your appointment show rate by event type. This may provide great insights on performance of different types of meetings you hold with leads and/or clients that you would have never thought to look into before.
Some firms have designated sales people as opposed to (or in addition to) intake staff and paralegals. As with any sales team, it is crucial to be able to track each individual’s conversion rate in order to compensate and incentivize the team. Use the Sales Stats graph to do just that, by viewing a breakdown of conversion stats by sales person.
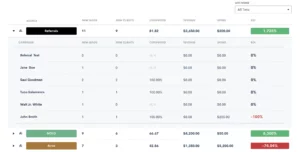
Stats By Source
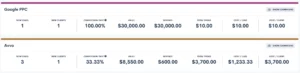
Lastly, on the Analytics page you will find the Stats by Source section. This gives you a comprehensive breakdown of key KPI calculations for each of your marketing sources.
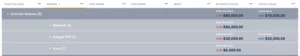
In this section you will be able to clearly see an apples to apples comparison of each source, taking into account how much you spent on that source, how many leads came in, the conversion rate, and a breakdown of cost per lead and client.
Example KPIs pictured above:
- Total new leads and converted clients by source
- Total revenue and total spend on each source
- Breakdown of cost per lead and cost per client
ROI Tracker
When used in conjunction with the Stats by Source analytics, the ROI Tracker helps complete the full picture of the marketing performance for each of your sources. The tracker takes into account the number of new leads, the conversion rate, and the revenue and spend from each source to give you an ROI calculation.
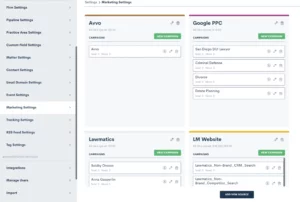
Marketing Source Spend
Before using the tracker, it is crucial to make sure that you are entering your marketing spend accurately on the marketing settings page. Once you navigate to that page in settings, you can make sure that you have all of your sources entered, along with any relevant campaigns under each source.
The marketing spend is logged at a campaign level. Once you have added your campaigns, click the dollar sign icon for each one to enter the spend for that particular campaign.
This spend will be used for calculations not only on the ROI Tracker, but also for the Stats by Source section of the Analytics page.
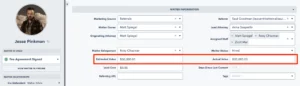
Matter Values
In order to get insightful ROI results you will also need to make sure you populate the revenue on each matter into the built-in Actual Value field. This step is crucial for making sure you get an accurate return on investment calculation.
Remember, you’ll populate both the estimated value and actual value in the details page on any matter.
Put Your Data to Use
While all this data collection and reporting potential is great, the crucial next step to growing your firm is interpreting your KPIs and reports to make insightful decisions about the future of your firm.
Instead of just being aware of a marketing source that has low to zero ROI, you now have the insight with Lawmatics to reduce your spend accordingly so you’re not investing in a poorly performing source. Maybe you have always had an idea of which of your practice areas was the most profitable, but now that you have the ability to actually track the exact performance, you may realize that it makes sense to invest more in a different practice area.
All of these insights are right at your fingertips with the power of Lawmatics reporting and analytics.